Optimizing Website Load Times with Full-Page Screenshots

Sofia Martinez
06 May 2025 - 01 Min read
Website performance is a key factor that affects everything from user engagement to SEO rankings. However, diagnosing loading issues can be challenging — especially when dynamic content, lazy loading, or complex animations are involved.
Full-page screenshots offer a visual way to identify performance bottlenecks and ensure your content loads as intended.
Why Use Full-Page Screenshots for Performance Audits?
- Visualize Layout Shifts: Detect cumulative layout shifts that negatively impact your Core Web Vitals score.
- Catch Slow-Loading Elements: See which sections or assets appear late and degrade the user experience.
- Identify Broken Components: Quickly spot missing images, fonts, or CSS that fail to load properly.
- Validate Lazy-Loaded Content: Ensure deferred elements render correctly under real-user conditions.
Practical Tips for Performance Debugging
- Capture screenshots after setting custom delay timers to allow full asset loading.
- Simulate device-specific loading using different screen sizes and network throttling.
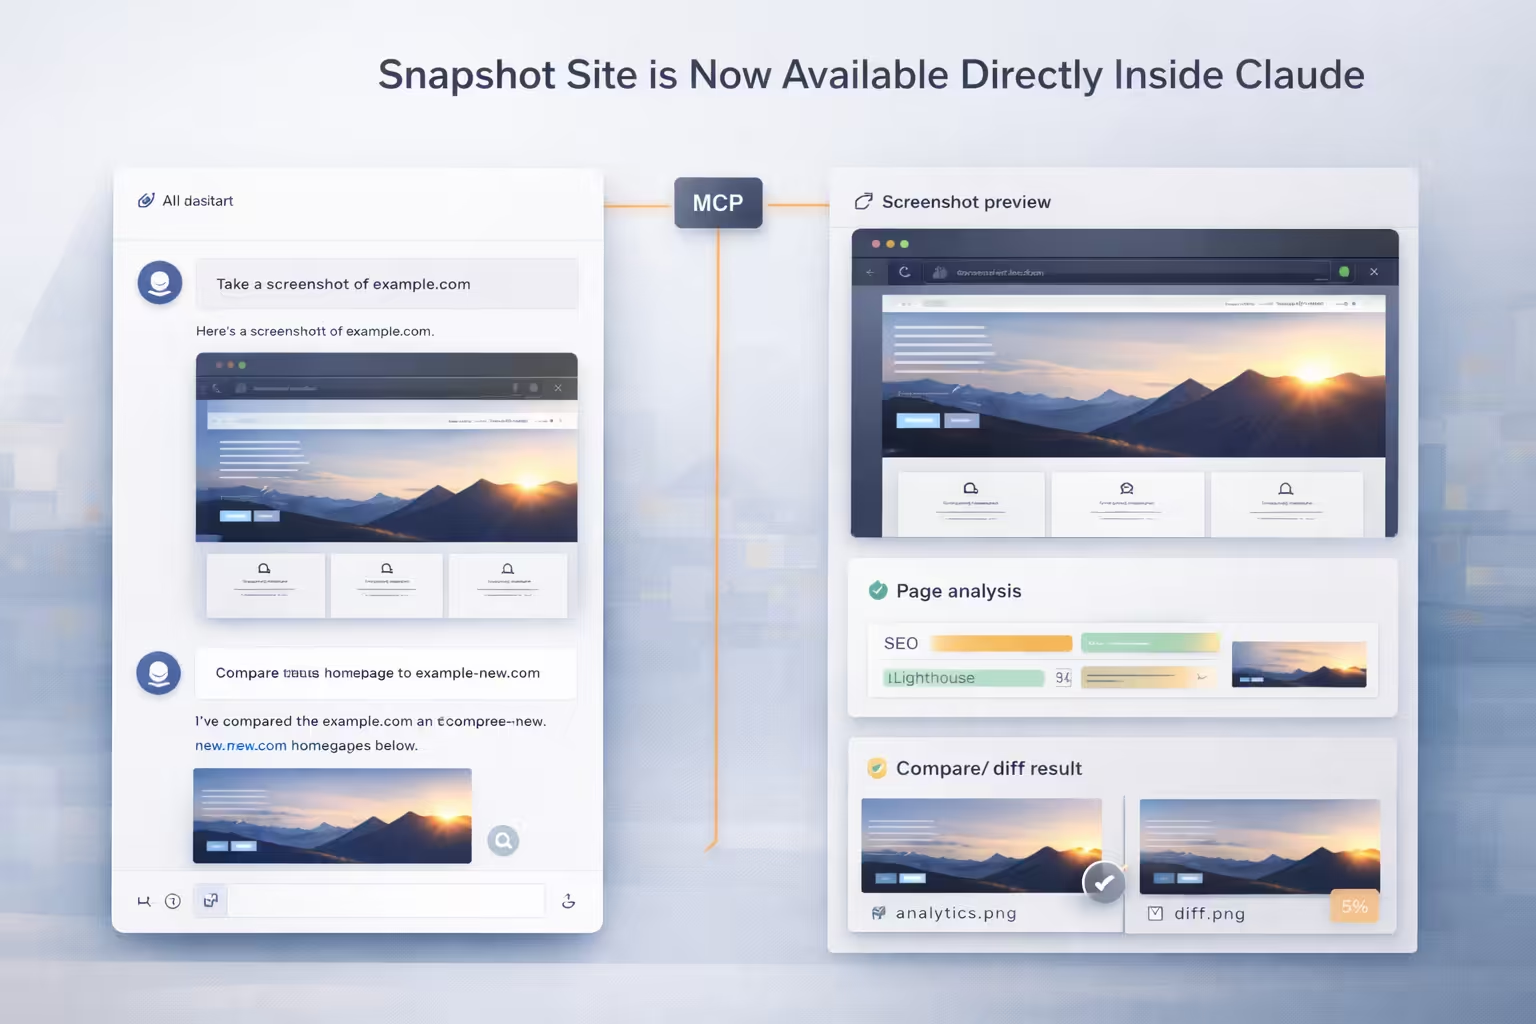
- Combine screenshot results with Lighthouse reports for deeper diagnostics.
"Combining automated screenshots with traditional performance tools gives you a complete picture of how users experience your site."
!Snapshot Site Team
Conclusion
Integrating full-page screenshots into your QA and performance analysis workflow ensures your website loads fast, looks perfect, and delivers the best possible user experience — every time.
Ready to optimize your web performance? Explore Snapshot Site API today.