Website monitoring beyond HTTP status
A website can return 200 OK and still be unusable. A stylesheet may fail, a consent dialog may cover the interface, a responsive component may collapse, or a deploy may remove an important section while the server continues responding normally.
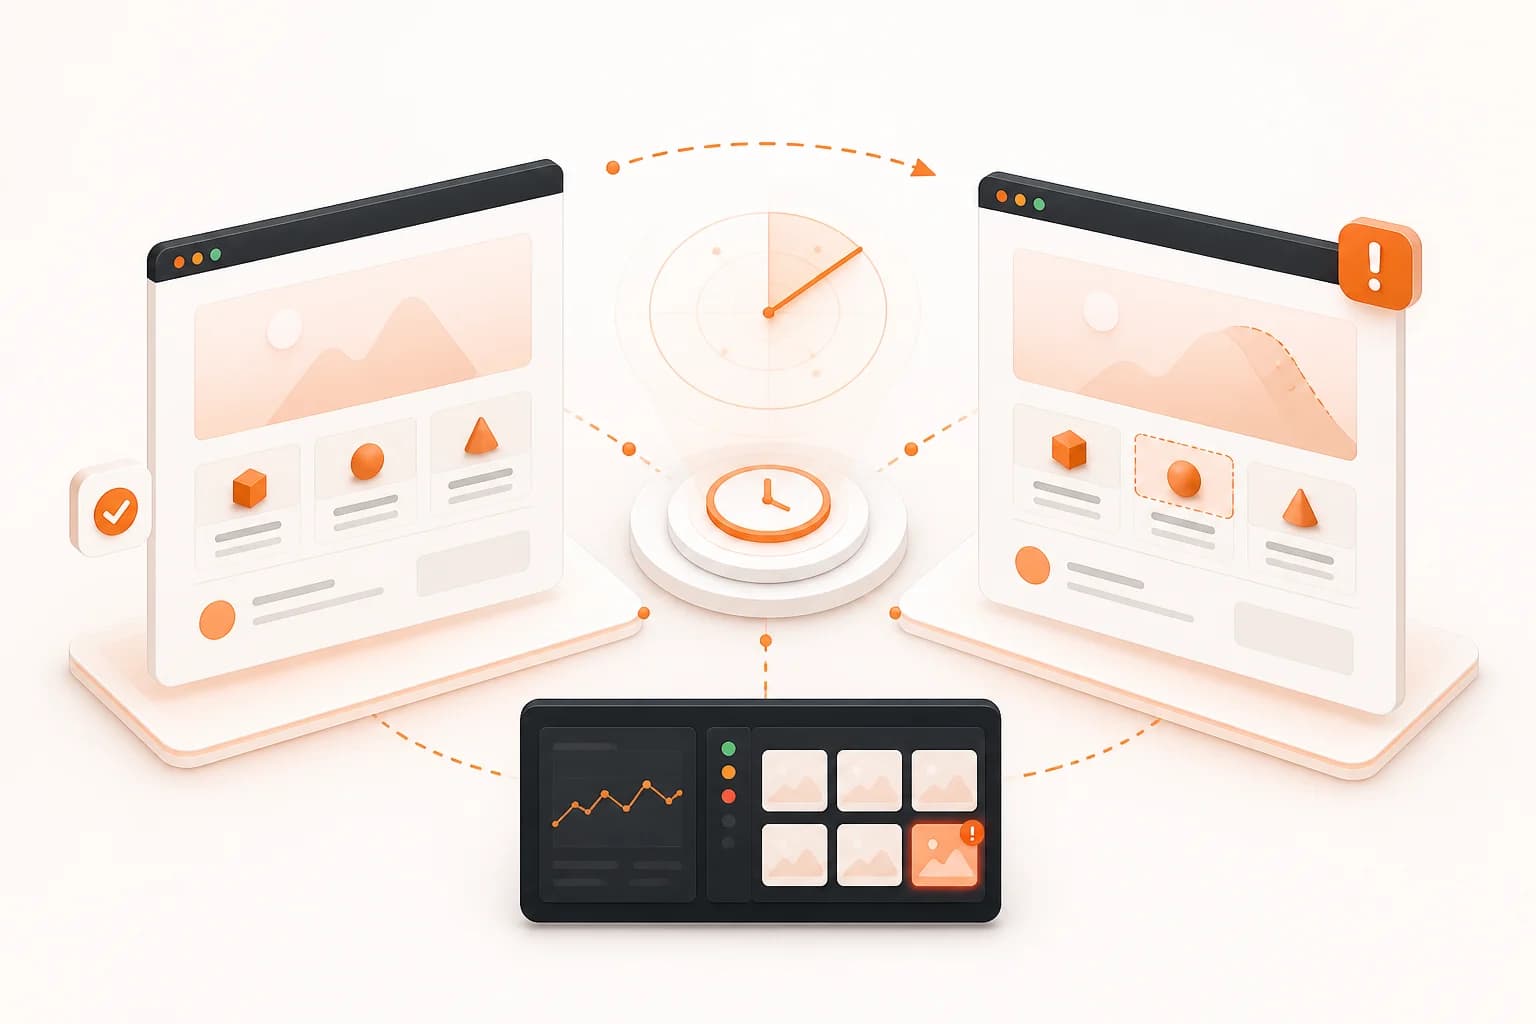
Visual website monitoring records what a browser rendered and compares it with a known state. Snapshot Site provides the capture and comparison layer through POST /api/v3/compare. Your scheduler decides when to run the check, and your workflow decides what to do with the mismatch result and diff image.
This separation keeps monitoring flexible. A cron job can check a public status page every hour. CI can check production immediately after deployment. An n8n workflow can compare partner pages and send a diff to a review channel.
The baseline monitoring model
1. Capture a known-good state
Create the baseline when the page has been reviewed and accepted. Record the image URL and every capture option that affects rendering: width, full-page mode, delay, cookie handling, and hidden selectors.
The baseline is not simply “the most recent capture.” It is the approved state against which new captures are judged. Replacing it should be a deliberate action after an intentional change.
2. Capture on a justified schedule
The interval depends on the risk and change rate. A checkout or public status page may need frequent checks. A legal or documentation page may need a daily or weekly review. Higher frequency creates more data and more opportunities for transient differences, so align it with the response time the team can actually support.
3. Compare and route the result
The compare response includes mismatch information and a diff image. Use the number to triage and the image to understand. A threshold can decide which jobs create an alert, but a reviewer should still see the highlighted regions before treating every difference as an incident.
Build reproducible monitoring captures
Keep the baseline and candidate settings identical. A different width can activate another responsive layout. A different delay can catch another animation frame. A cookie dialog present in one image but hidden in the other can dominate the diff.
For long landing pages, use full-page capture consistently. For visual QA details, see the Visual Diff API guidance on thresholds, baselines, and false positives.
Dynamic content and false alerts
News tickers, clocks, rotating testimonials, personalized recommendations, ads, and live counters change independently of page health. Where possible, use deterministic test data or remove only those regions with stable selectors. Every hidden region reduces noise and coverage, so keep the exclusion list narrow.
For third-party pages, accept that some variation may be unavoidable. Measure normal change over several runs before choosing an alert threshold.
What to monitor visually
Revenue and conversion pages
Pricing, checkout, signup, and campaign pages can remain online while a visual defect blocks conversion. Monitor the desktop and mobile states that contribute most to the business, not every conceivable size.
Status pages and dashboards
A status page should communicate incidents clearly. Visual monitoring can detect a missing component, broken theme, or overlay that hides the message even when the underlying endpoint is available.
Partner and affiliate pages
Scheduled captures can support review of pages outside your deployment pipeline. Follow the relevant terms and policies, and treat differences as review signals rather than automatic proof of non-compliance.
Documentation and public content
Monitor pages where missing examples, navigation, or calls to action create support load. A complete screenshot can show whether the document assembled as intended after a CMS or theme change.
Alert design and incident handling
An alert should contain the monitored URL, capture time, mismatch signal, and links to before, after, and diff images. Route it to the team that can evaluate the page. A mismatch without visual context forces responders to reproduce the problem before they can decide what happened.
Classify outcomes explicitly:
- Expected change: approve and update the baseline.
- Visual regression: open an incident or release fix.
- Dynamic noise: improve capture stability or narrow an exclusion.
- Capture failure: retry according to a bounded policy and inspect API diagnostics.
Do not update the baseline automatically after every mismatch. That can turn an undetected defect into the new approved reference.
Security and operational practices
Store the API key in the scheduler's secret manager. Do not place it in client-side JavaScript or alert payloads. Sanitize URLs before logging them when query parameters may contain credentials or private identifiers.
Avoid overlapping jobs for the same page when a previous capture is still running. Cache stable outputs, use bounded retries, and keep an ownership record for every monitor so alerts do not become unmaintained noise.
Visual monitoring complements uptime checks, functional tests, security monitoring, and analytics. It answers whether the rendered page changed; the other systems explain availability, behavior, integrity, and business impact.
Common website monitoring mistakes
- Treating the latest capture as an automatically approved baseline.
- Comparing pages with different widths or timing settings.
- Alerting on every changed pixel without measuring normal variation.
- Hiding broad page regions to silence false positives.
- Sending alerts without before, after, and diff context.
- Running checks more frequently than the team can respond.
- Using visual monitoring as the only security or availability control.
Start with one high-value page, tune it across intentional and accidental changes, then reuse the proven pattern through screenshot automation.